

Research
Geodynamics and Earth structure
Tectonic and geodynamic processes at back-arc and continental margins, intraplate magmatism, and lithosphere, asthenosphere, and mantle-transition-zone structure in Northeast Asia.
-
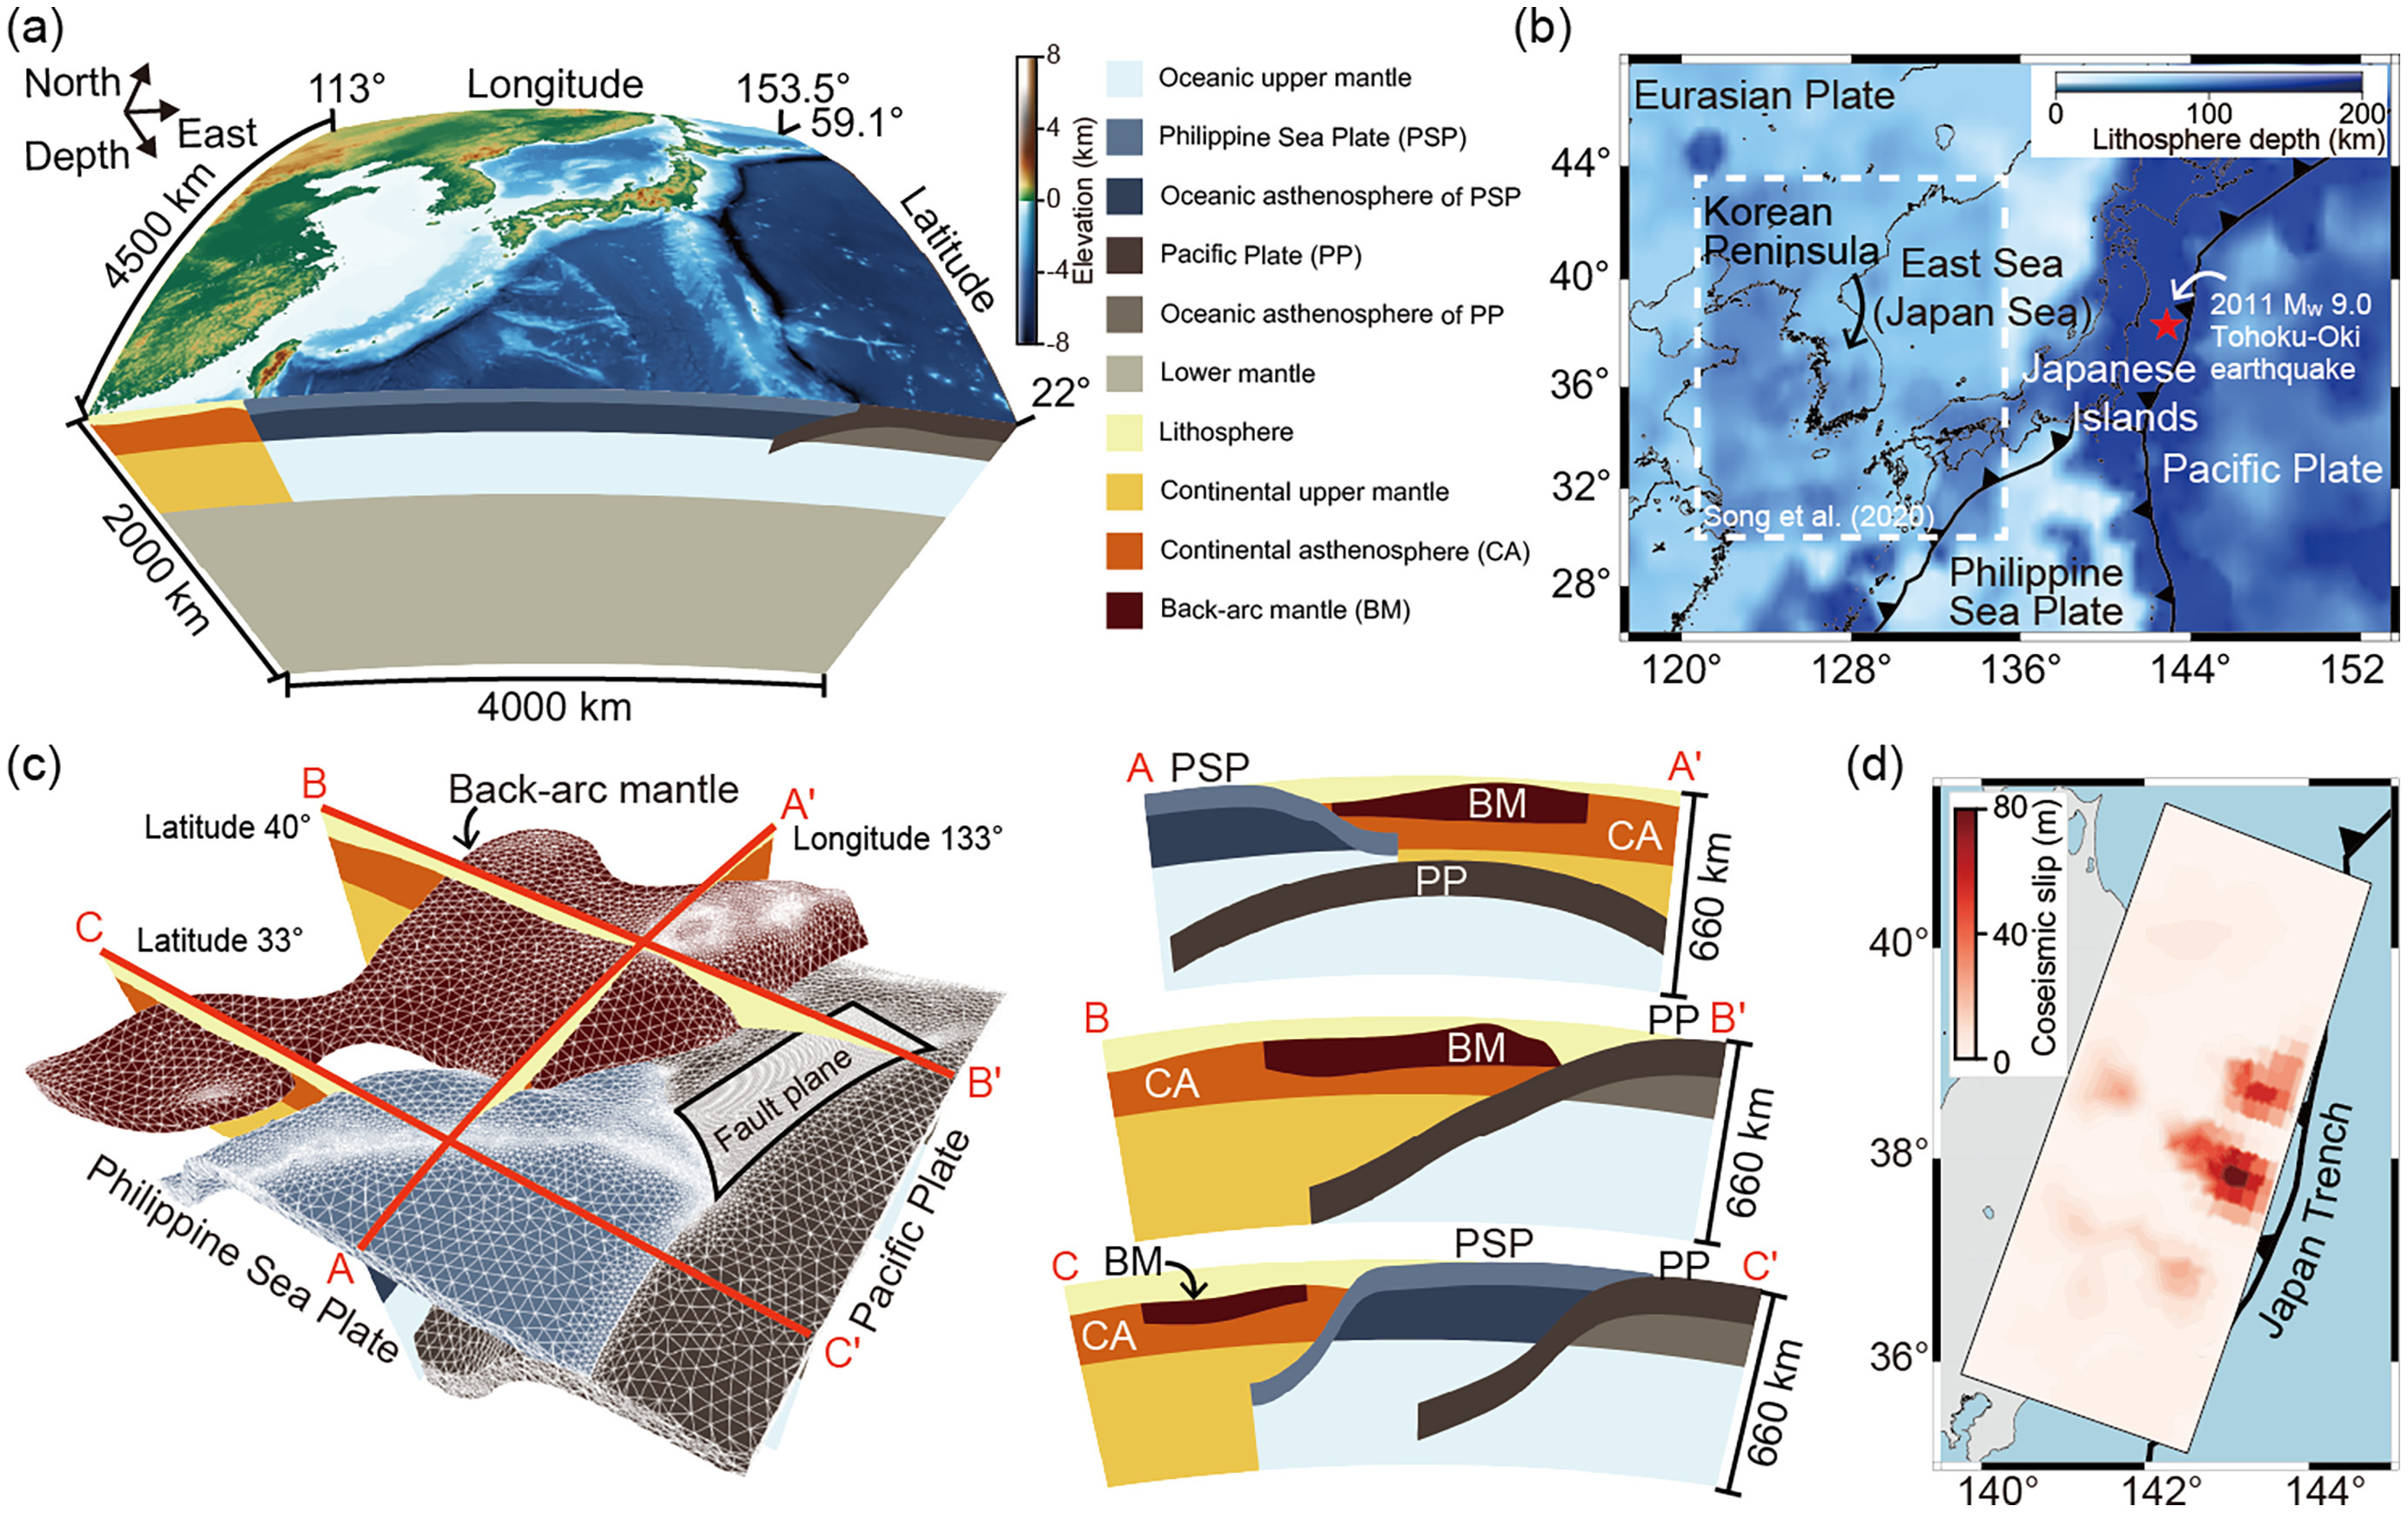
Low-viscosity back-arc mantle controls the early transient deformation, whereas the continental asthenosphere governs the steady-state response across the Korean Peninsula.
Kim et al. (2026), Earth and Planetary Science Letters, Figure 1. · CC BY 4.0
Earth and Planetary Science Letters ·
-
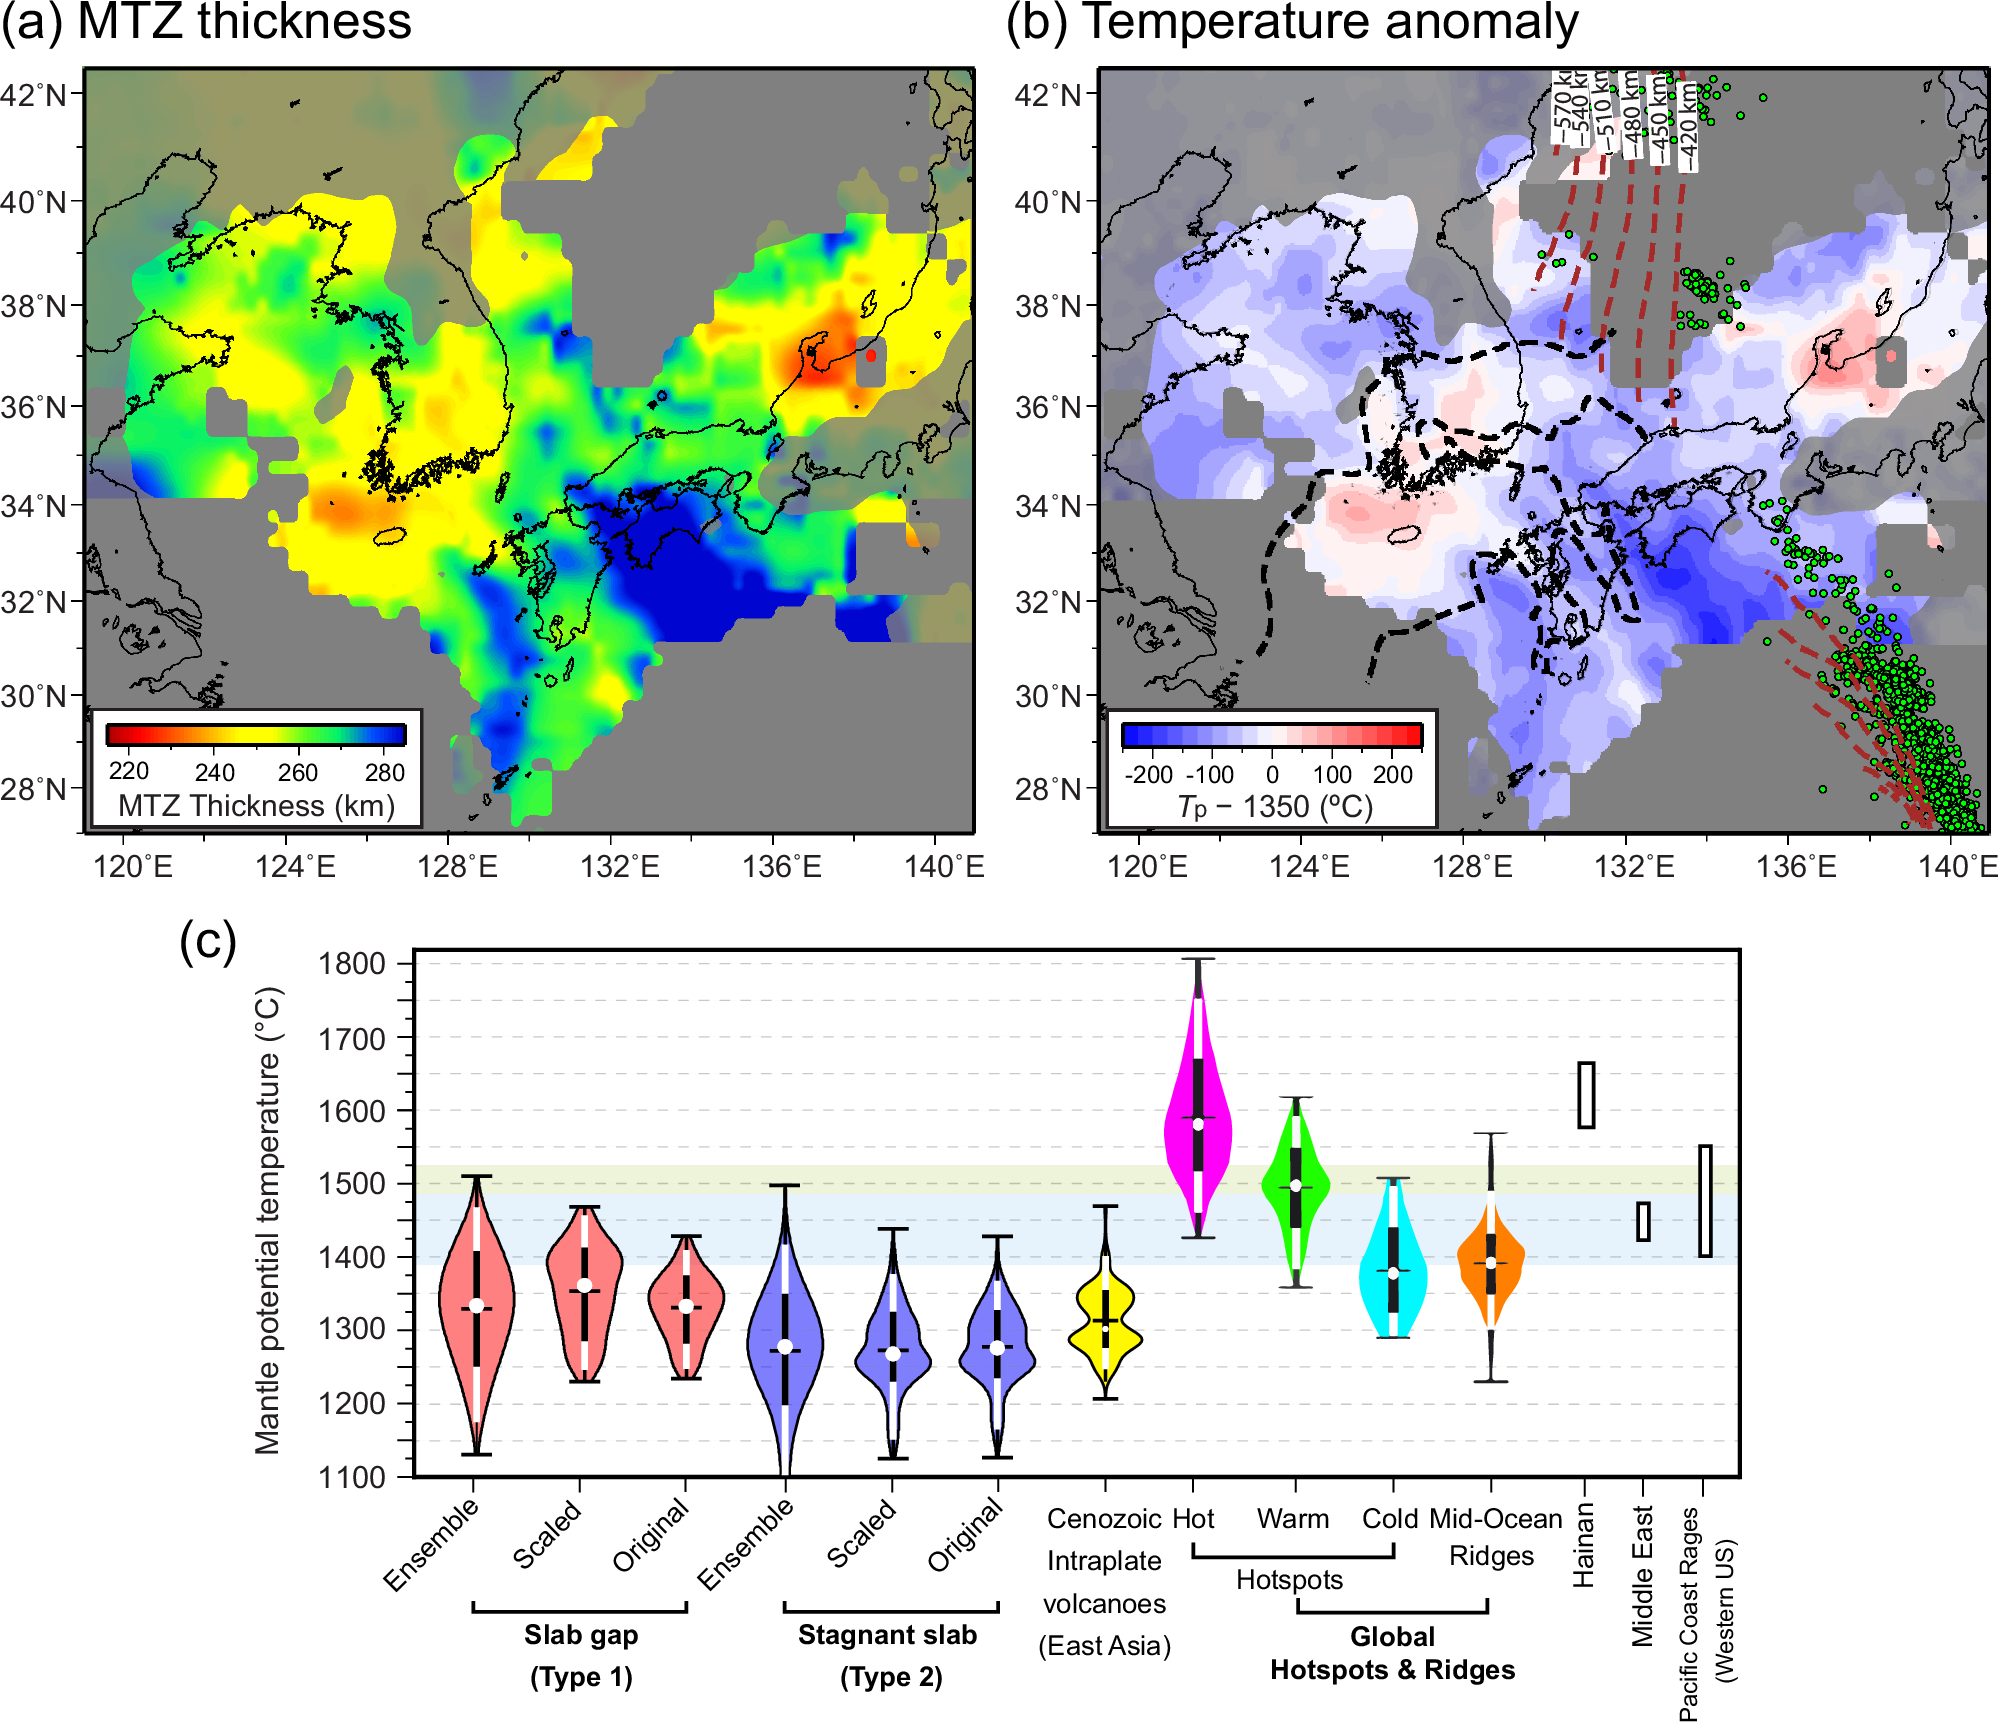
The roughly 1,000-km arcuate gap has sharp lateral boundaries, temperatures more than 200 °C below plume-like conditions, and a planform aligned with the path of a migrating triple junction.
Song et al. (2026), Nature Communications, Figure 5. · CC BY-NC-ND 4.0
[41] Continuous nonthermal slab gap formed by progressive tearing beneath Northeast Asia
Nature Communications ·
-
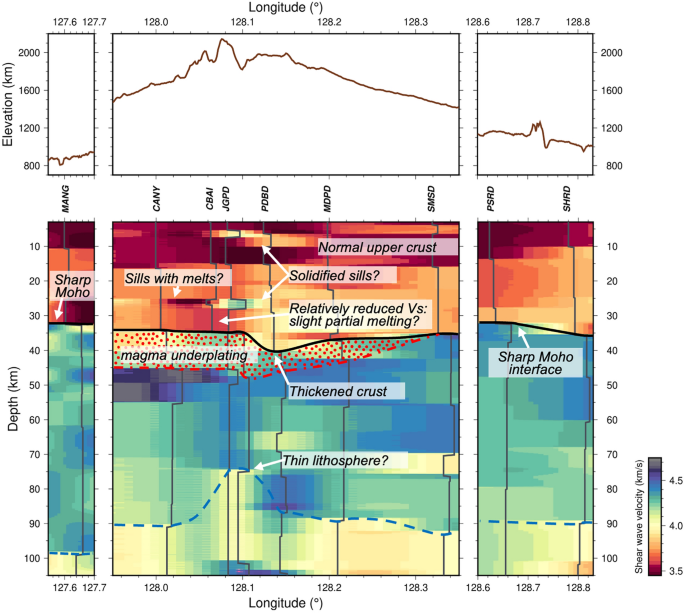
The Moho deepens from 31–34 km around Mount Baekdu to 35–40 km beneath it, while shallow high velocities and lower-crustal low velocities suggest intrusions and possible partial melt.
Lim and Kim (2025), Geosciences Journal, Figure 10. · CC BY 4.0
Geosciences Journal ·
-
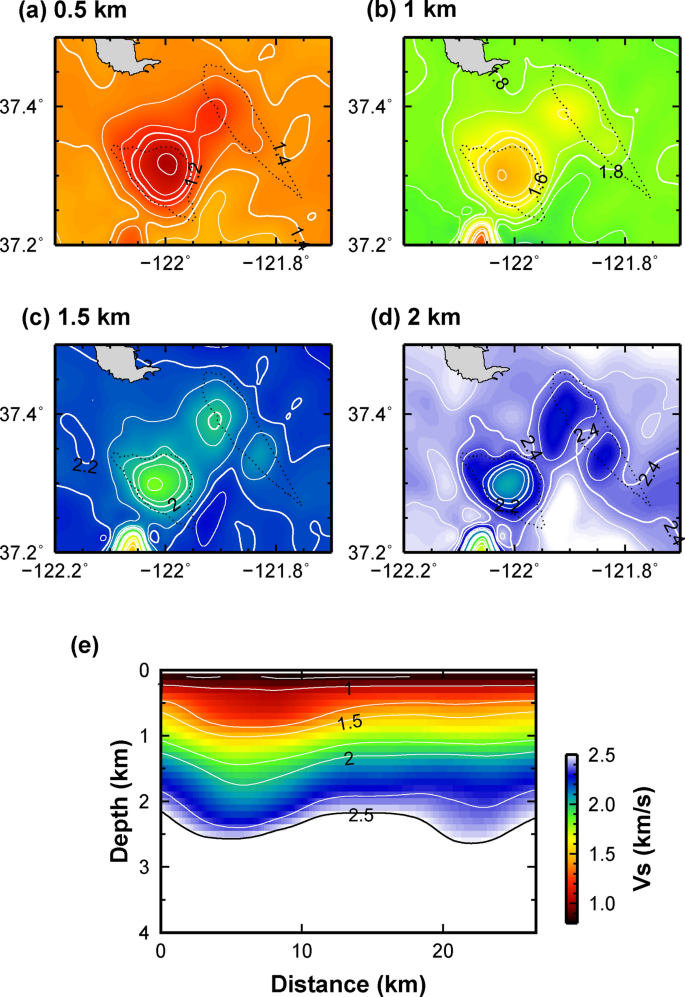
The Cupertino and Evergreen basins are distinguished, with approximate areas of 25–100 km² and basement depths of 2.5–3 km.
Cho et al. (2025), Geosciences Journal, Figure 6. · CC BY 4.0
[35] Imaging the 3D basin structure of the Santa Clara Valley by ambient noise tomography
Geosciences Journal ·


Seismological methods
Bayesian inversion, machine-learning methods, and seismic interferometry using diffuse wavefields.
-
The KSMMA-specific scale uses 4,043 earthquakes, reduces interstation scatter, and yields magnitudes about 0.3 units lower on average than previous regional scales.
Seismological Research Letters ·
-
The Moho deepens from 31–34 km around Mount Baekdu to 35–40 km beneath it, while shallow high velocities and lower-crustal low velocities suggest intrusions and possible partial melt.
Lim and Kim (2025), Geosciences Journal, Figure 10. · CC BY 4.0
Geosciences Journal ·
-
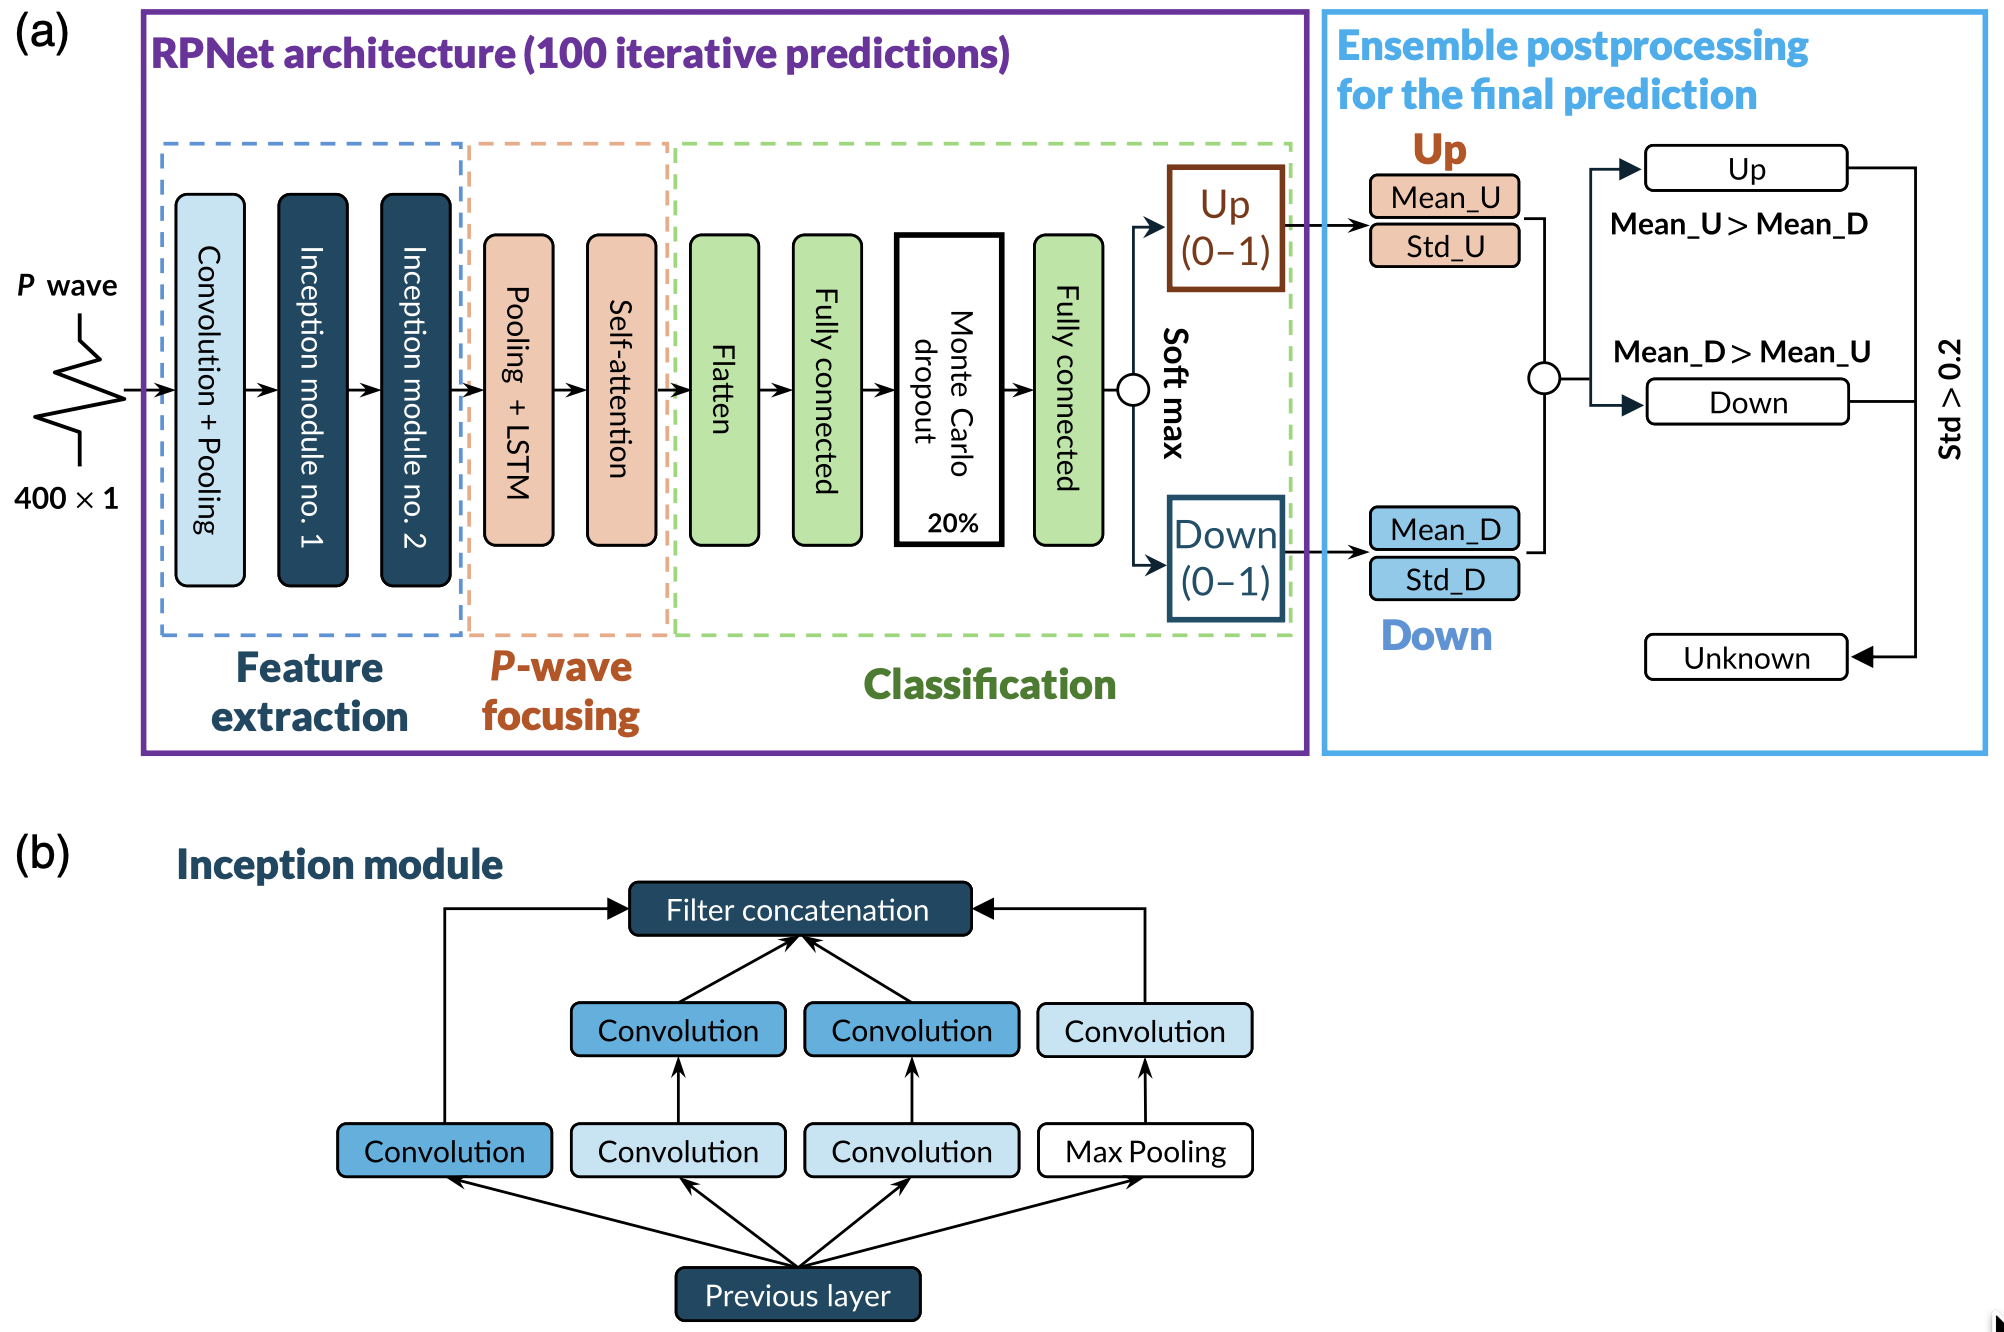
RPNet combines inception modules, self-attention, and Monte Carlo dropout to determine P-wave first-motion polarity while quantifying prediction uncertainty.
Han, Kim, and Sheen (2025), Seismological Research Letters, Figure 1. · Author-provided image; reuse not permitted
[36] RPNet: Robust P-wave first-motion polarity determination using deep learning
Seismological Research Letters ·
-
The Cupertino and Evergreen basins are distinguished, with approximate areas of 25–100 km² and basement depths of 2.5–3 km.
Cho et al. (2025), Geosciences Journal, Figure 6. · CC BY 4.0
[35] Imaging the 3D basin structure of the Santa Clara Valley by ambient noise tomography
Geosciences Journal ·

Earthquake properties
Large-volume event detection, source-property estimation, and source-mechanism analysis with quantitative uncertainty.
-
Low-viscosity back-arc mantle controls the early transient deformation, whereas the continental asthenosphere governs the steady-state response across the Korean Peninsula.
Kim et al. (2026), Earth and Planetary Science Letters, Figure 1. · CC BY 4.0
Earth and Planetary Science Letters ·
-
The KSMMA-specific scale uses 4,043 earthquakes, reduces interstation scatter, and yields magnitudes about 0.3 units lower on average than previous regional scales.
Seismological Research Letters ·
-
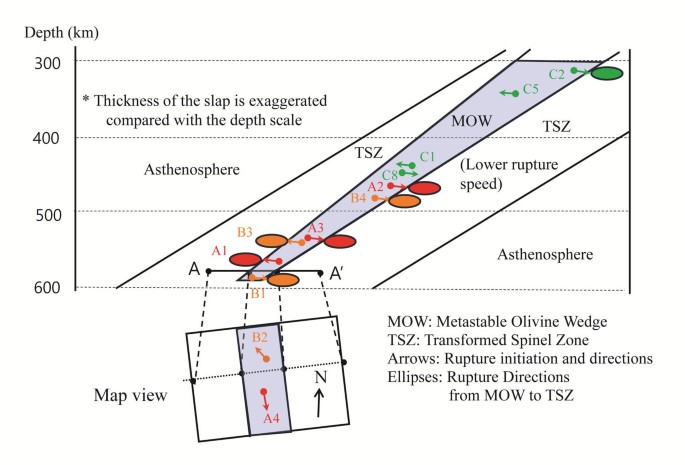
Smaller events generally rupture faster and larger multi-subevent events more slowly; the duration–moment slope is about 0.26 and rupture lengths are 8.6–30.9 km.
Baag et al. (2026), Geosciences Journal, Figure 8. · CC BY 4.0
Geosciences Journal ·
-
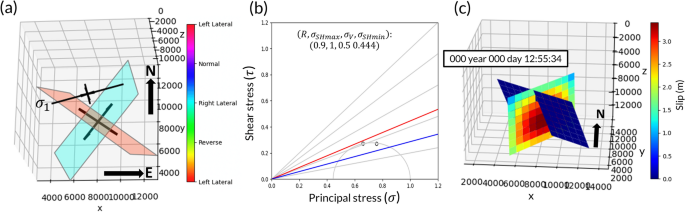
A NNE–SSW right-lateral fault and a nearly orthogonal WNW–ESE fault were identified; the former is favorably oriented, whereas the latter requires weakening or triggering.
Han and Kim (2025), Geosciences Journal, Figure 8. · CC BY 4.0
Geosciences Journal ·
Earthquake engineering
Ground-motion prediction, seismic hazard, three-dimensional high-frequency simulations, and surface and subsurface structural response in the Korean Peninsula.
-
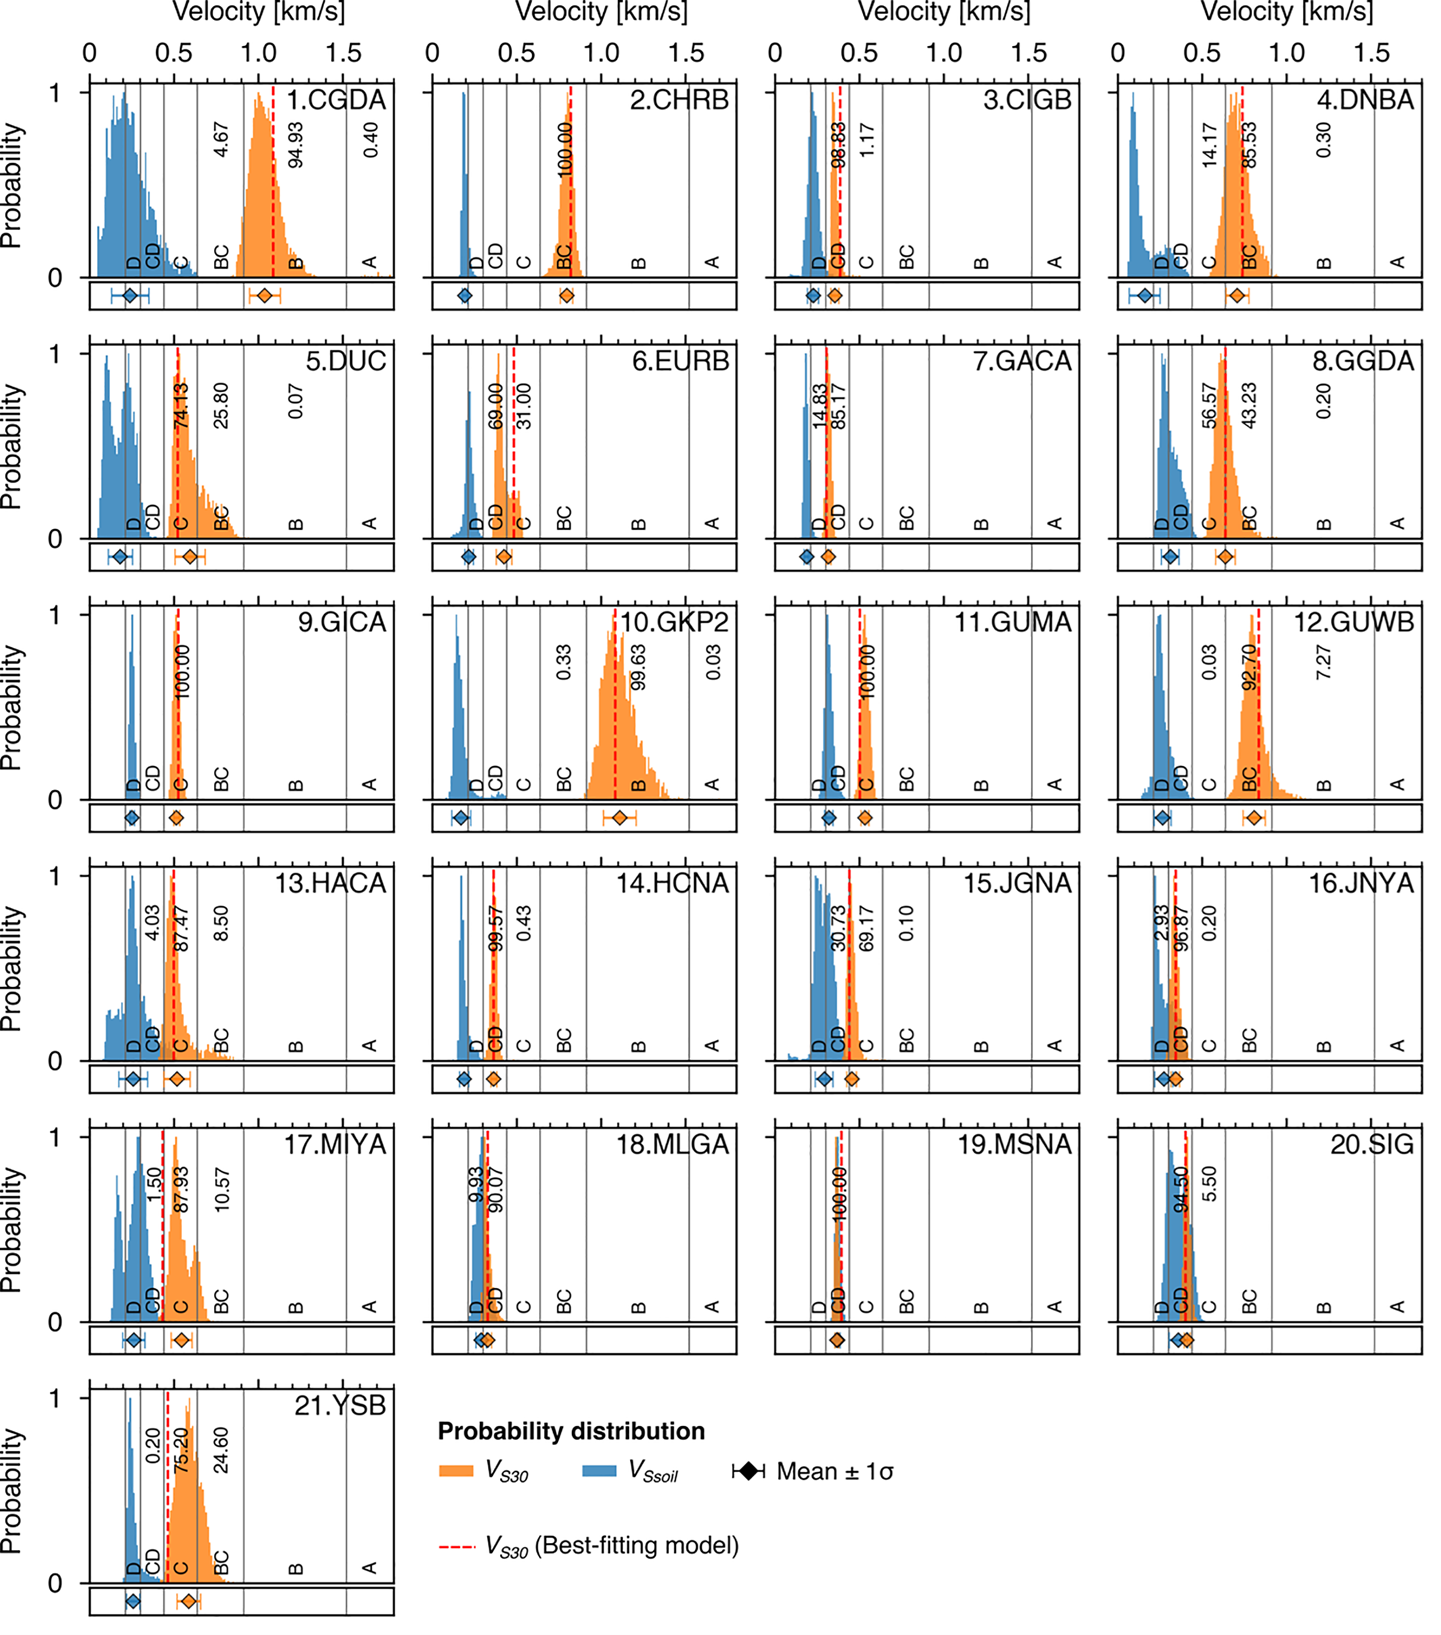
Profiles extend to as much as 1,000 m and generally agree with borehole constraints; VS30, rock depth, and soil velocity yield site classes B–D.
Jeon et al. (2026), Bulletin of Earthquake Engineering, Figure 8. · CC BY-NC-ND 4.0
Bulletin of Earthquake Engineering ·
-
The Cupertino and Evergreen basins are distinguished, with approximate areas of 25–100 km² and basement depths of 2.5–3 km.
Cho et al. (2025), Geosciences Journal, Figure 6. · CC BY 4.0
[35] Imaging the 3D basin structure of the Santa Clara Valley by ambient noise tomography
Geosciences Journal ·
-
The simulations reproduced surface waves, directivity, and amplification with PGV log-residual mean −0.28 and standard deviation 0.78, and produced Mw 6.0–7.0 scenario distributions.
Bulletin of the Seismological Society of America ·
-
A transition from approximately 200 m/s near the surface to roughly 3,600 m/s bedrock occurs at about 4–30 m depth.
Geosciences Journal ·

Environmental seismology
Seismic responses associated with groundwater and other physical-property changes.
No publication has yet been assigned to this area.